One of the questions I often get is “what happened to you?” I have tried to explain it, but I haven’t found a way to explain the way I wanted.
Then I remembered that, in the discovery phase of my journey, the doctors shared a diagram with us to explain what had happened.
Taking a look at the diagram.
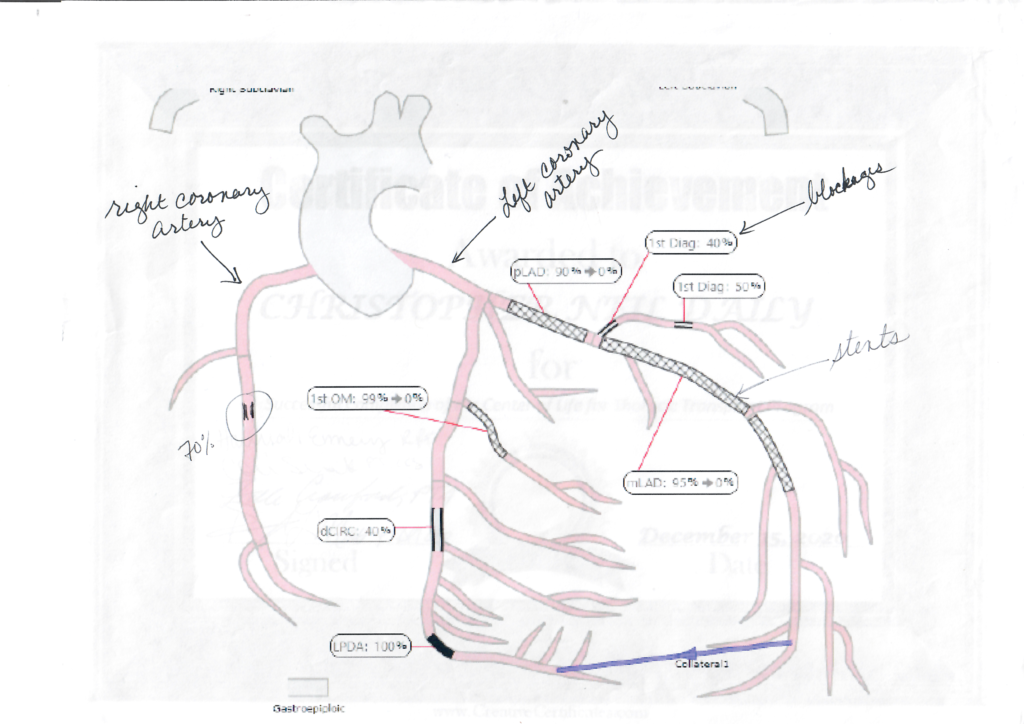
You’ll notice that I had a number of blockages. There were a significant number of blockages on the ventricle (left) side of my heart.
Stints were added, but the damage had already been done. The lack of blood to the left side did significant damage to the nerves on that side of the heart. The damage caused the nerves on the left side of my heart to fire in a chaotic order at times. Nerves firing at the same time randomly are referred to as a VT storm.
I had several VT storms with the last one being the one that put me on an ECMO.
At the time the doctors gave us this, I naively thought I could recover. Was I wrong or what?
Thanks for coming in today.
Chris